

10 javascript gauges drived from VFP
This is a set of 10 javascripts tests of javascript gauges from https://github.com/Mikhus/canvas-gauges.
its licencied under MIT (read the Github project).
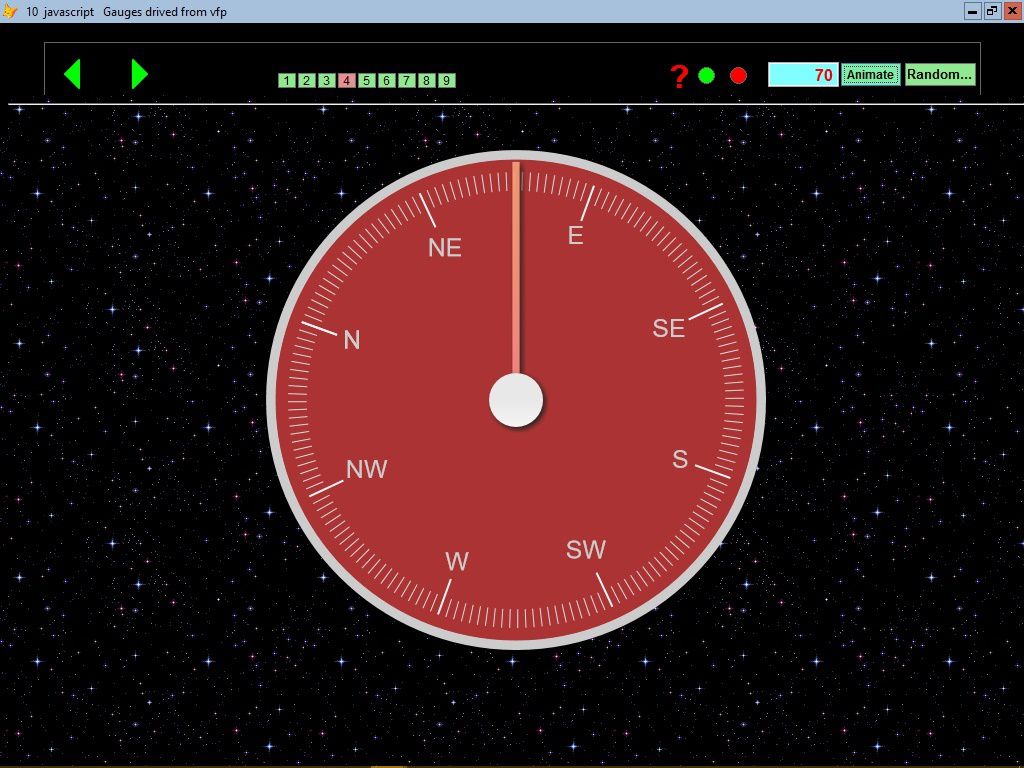
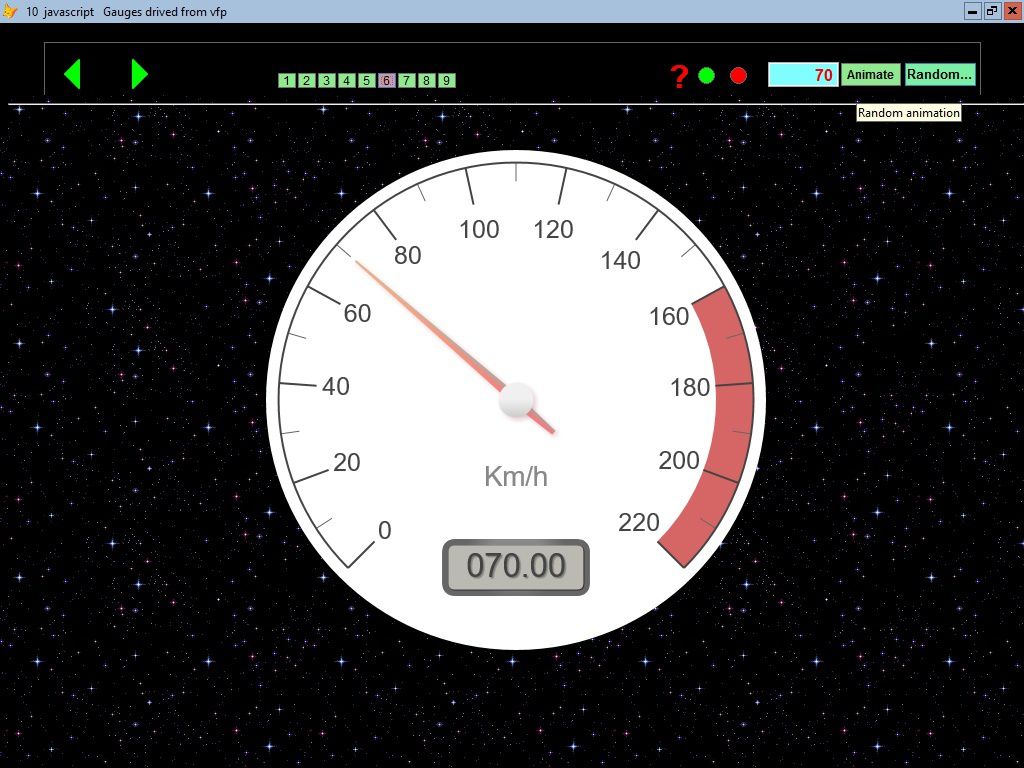
the codes are gathered in a vfp cursor and the form can rotates all the gauges contained.
each gauge is drawn on an html5 canvas and rendered.it can be animated with any angle set or by random one.
a timer animates the gauge at starting.
note that the gauge can be rendered with gdiplusX library.(i write it next post ).
can capture the gauge area with the red shape to a png image (in source folder) for gauge1-9.
i used the the canvas method toDataUrl to achieve this option(as well as gdiplusX imgcanvas.oBMP.save method).
can click the arrows (next-preview) buttons or the commandbuttons to run any gauge of the 9 ones and thes green shape to run the special 10 one animated.
can download the project from Github and run it on disc(offline).
i tested the linear gauges but infortunatly does not work or IE11(or emulation).
of course internet must be connected to access the gauge.js file and background image.
update:the ie11 bug was pointed to the author and he corrected it.the gaude.js is now at version 2.1.2 and have changed with this bug,that why i updated the code adding many linear gauges demos.
read https://github.com/Mikhus/canvas-gauges/issues/101#event-917364046
Click on code to select [then copy] -click outside to deselect
*1* updated on  10 of january 2016
*there was an IE11 bug for all linear gauges.i Adised the author and he corrected this bug
*added 2 linear guges demo and a linear gauge  anmation .

Publi yform
yform=Newobject("ygauges")
yform.Show
Read Events
Retu
*
Define Class yGauges As Form
	Height = 529
	Width = 952
	ShowWindow = 2
	ShowTips = .T.
	AutoCenter = .T.
	Caption = "10  javascript   Gauges drived from vfp"
	BackColor = Rgb(0,0,0)
	Name = "Form1"

	Add Object olecontrol1 As OleControl With ;
		Oleclass="shell.explorer.2" , ;
		Top = 72, ;
		Left = 0, ;
		Height = 456, ;
		Width = 960, ;
		Anchor = 15, ;
		Name = "Olecontrol1"

	Add Object container1 As ycont With ;
		Anchor = 768, ;
		Top = 5, ;
		Left = 8, ;
		Width = 937, ;
		Height = 61, ;
		BackStyle = 0, ;
		ToolTipText = "", ;
		Name = "Container1"

	Procedure ybuild
		Lparameters Code
		Local u
		Try
			With Thisform.container1
				.SetAll("backcolor",Rgb(0,255,0),"commandbutton")
				u=Eval(".yg"+Trans(Recno()))
				u.BackColor=255
			Endwith
		Catch
		Endtry

		Local m.myvar
		TEXT to m.myvar textmerge noshow
<!doctype html>
<html class="no-js" lang="en">
<head>
<meta charset="iso_8859-1"><meta name="viewport" content="width=device-width, initial-scale=1.0">
<style>body {background-color:black; background:url('https://s-media-cache-ak0.pinimg.com/originals/e1/a0/ef/e1a0ef685ab2c885a3b837db6f6ebd6d.gif') repeat;}</style>
<script src="https://rawgit.com/Mikhus/canvas-gauges/v2.1.2/gauge.min.js"></script>
<body >
<input type="text" id="gauge-value" placeholder="put new gauge value here" value="0" style="display:none;">
<button id="yb" style="display:none;" onclick="animateGauges()">Animate</button>
<hr>
<<code>>
<script>
if (!Array.prototype.forEach) {
Array.prototype.forEach = function(cb) {
	var i = 0, s = this.length;
	for (; i < s; i++) {
		cb && cb(this[i], i, this);
	}
}
}
document.fonts && document.fonts.forEach(function(font) {
font.loaded.then(function() {
	if (font.family.match(/Led/)) {
		document.gauges.forEach(function(gauge) {
			gauge.update();
		});
	}
});
});

function animateGauges() {
document.gauges.forEach(function(gauge) {
	gauge.value = parseFloat(
		document.getElementById('gauge-value').value) || 0;
	setTimeout(function() {
		console.log('new gauge value:' + gauge.value);
	}, 1510);
});
}
</script>
		ENDTEXT

		Local m.lcdest
		m.lcdest=Addbs(Sys(2023))+"ytemp.html"
		Strtofile(m.myvar,m.lcdest)
		Thisform.olecontrol1.Navigate(m.lcdest)
		Thisform.container1.timer1.Enabled=.T.

		With Thisform.container1
			.text1.Enabled=.T.
			.command1.Enabled=.T.
			.command2.Enabled=.T.
			.shape2.Enabled=.T.
		Endwith
	Endproc

	Procedure my
		Lparameters nButton, nShift, nXCoord, nYCoord
		*--- aevent create an array laEvents
		Aevents( myArray, 0)
		*--- reference the calling object
		loObject = myArray[1]
		loObject.Parent.SetAll("backcolor",Rgb(0,255,0),"commandbutton")
		loObject.BackColor=255
		Sele ycurs
		Go Int(Val(loObject.Caption))
		Thisform.ybuild(Code)
	Endproc

	Procedure my1
		Lparameters nButton, nShift, nXCoord, nYCoord
		*--- aevent create an array laEvents
		Aevents( myArray, 0)
		*--- reference the calling object
		loObject = myArray[1]

		Try
			With Thisform.olecontrol1.Document
				.getElementById("gauge-value").Value=Int(Val(loObject.Caption))
				.getElementById("yb").Click(.T.)
			Endwith
		Catch
		Endtry
	Endproc

	Procedure Init
		_Screen.WindowState=1
		Thisform.WindowState=2
		Publi m.yrep
		m.yrep=Addbs(Justpath(Sys(16,1)))
		Set Defa To (yrep)

		Local m.delta
		m.delta=3
		Sele ycurs
		With Thisform.container1
			For i=1 To Reccount()
				.AddObject("yg"+Trans(i),"commandbutton")
				With Eval(".yg"+Trans(i))
					.Left=230+(i-1)*20+m.delta
					.Top=30
					.Width=20
					.BackColor=Rgb(0,255,0)
					.Caption=Trans(i)
					.MousePointer=15
					.Visible=.T.
				Endwith
				Bindevent(Eval(".yg"+Trans(i)),"mousedown",Thisform,"my")
			Endfor
		Endwith
		Thisform.ybuild(Code)
	Endproc

	Procedure Load
		Set Safe Off
		Create Cursor ycurs (Code m)
		Local m.myvar
		TEXT to m.myvar noshow
<br><br><center>
<canvas  data-type="radial-gauge"
id="ycanvas"
data-width="500"
data-height="500"
data-units="°C"
data-title="Temperature"
data-min-value="-50"
data-max-value="50"
data-major-ticks="[-50,-40,-30,-20,-10,0,10,20,30,40,50]"
data-minor-ticks="2"
data-stroke-ticks="true"
data-highlights='[ {"from": -50, "to": 0, "color": "rgba(0,0, 255, .3)"},
{"from": 0, "to": 50, "color": "rgba(255, 0, 0, .3)"} ]'
data-ticks-angle="225"
data-start-angle="67.5"
data-color-major-ticks="#ddd"
data-color-minor-ticks="#ddd"
data-color-title="#eee"
data-color-units="#ccc"
data-color-numbers="#eee"
data-color-plate="#222"
data-border-shadow-width="0"
data-borders="true"
data-needle-type="arrow"
data-needle-width="2"
data-needle-circle-size="7"
data-needle-circle-outer="true"
data-needle-circle-inner="false"
data-animation-duration="1500"
data-animation-rule="linear"
data-color-border-outer="#333"
data-color-border-outer-end="#111"
data-color-border-middle="#222"
data-color-border-middle-end="#111"
data-color-border-inner="#111"
data-color-border-inner-end="#333"
data-color-needle-shadow-down="#333"
data-color-needle-circle-outer="#333"
data-color-needle-circle-outer-end="#111"
data-color-needle-circle-inner="#111"
data-color-needle-circle-inner-end="#222"
data-value-box-border-radius="0"
data-color-value-box-rect="#222"
data-color-value-box-rect-end="#333"
></canvas></center>
		ENDTEXT
		Insert Into ycurs Values(m.myvar)

		TEXT to m.myvar noshow
<br><br><center><canvas data-type="radial-gauge"
id="ycanvas"
data-width="500"
data-height="500"
data-min-value="0"
data-max-value="360"
data-major-ticks="N,NE,E,SE,S,SW,W,NW,N"
data-minor-ticks="22"
data-ticks-angle="360"
data-start-angle="180"
data-stroke-ticks="false"
data-highlights="false"
data-color-plate="#3a3"
data-color-major-ticks="#f5f5f5"
data-color-minor-ticks="#ddd"
data-color-numbers="#ccc"
data-color-needle="rgba(240, 128, 128, 1)"
data-color-needle-end="rgba(255, 160, 122, .9)"
data-value-box="false"
data-value-text-shadow="false"
data-color-circle-inner="#fff"
data-color-needle-circle-outer="#ccc"
data-needle-circle-size="15"
data-needle-circle-outer="false"
data-animation-rule="linear"
data-needle-type="line"
data-needle-start="0"   //75
data-needle-end="99"
data-needle-width="3"
data-borders="true"
data-border-inner-width="0"
data-border-middle-width="0"
data-border-outer-width="10"
data-color-border-outer="#ccc"
data-color-border-outer-end="#ccc"
data-color-needle-shadow-down="#222"
data-border-shadow-width="0"
data-animation-duration="1500"
></canvas></center>
		ENDTEXT
		Insert Into ycurs Values( m.myvar)


		TEXT to m.myvar noshow
<br><br><center><canvas data-type="radial-gauge"
id="ycanvas"
data-width="500"
data-height="500"
data-min-value="0"
data-max-value="360"
data-major-ticks="N,NE,E,SE,S,SW,W,NW,N"
data-minor-ticks="22"
data-ticks-angle="360"
data-start-angle="180"
data-stroke-ticks="false"
data-highlights="false"
data-color-plate="#222"
data-color-major-ticks="#f5f5f5"
data-color-minor-ticks="#ddd"
data-color-numbers="#ccc"
data-color-needle="rgba(240, 128, 128, 1)"
data-color-needle-end="rgba(255, 160, 122, .9)"
data-value-box="false"
data-value-text-shadow="false"
data-color-circle-inner="#fff"
data-color-needle-circle-outer="#ccc"
data-needle-circle-size="15"
data-needle-circle-outer="false"
data-animation-rule="linear"
data-needle-type="line"
data-needle-start="0"  //75
data-needle-end="99"
data-needle-width="3"
data-borders="true"
data-border-inner-width="0"
data-border-middle-width="0"
data-border-outer-width="10"
data-color-border-outer="#ccc"
data-color-border-outer-end="#ccc"
data-color-needle-shadow-down="#222"
data-border-shadow-width="0"
data-animation-duration="1500"
></canvas>
		ENDTEXT
		Insert Into ycurs Values (m.myvar)

		TEXT to m.myvar noshow
<center><br><br><canvas data-type="radial-gauge"
id="ycanvas"
data-width="500"
data-height="500"
data-min-value="0"
data-max-value="360"
data-major-ticks="N,NE,E,SE,S,SW,W,NW,N"
data-minor-ticks="22"
data-ticks-angle="360"
data-start-angle="180"
data-stroke-ticks="false"
data-highlights="false"
data-color-plate="#a33"
data-color-major-ticks="#f5f5f5"
data-color-minor-ticks="#ddd"
data-color-numbers="#ccc"
data-color-needle="rgba(240, 128, 128, 1)"
data-color-needle-end="rgba(255, 160, 122, .9)"
data-value-box="false"
data-value-text-shadow="false"
data-color-circle-inner="#fff"
data-color-needle-circle-outer="#ccc"
data-needle-circle-size="15"
data-needle-circle-outer="false"
data-animation-rule="linear"
data-needle-type="line"
data-needle-start="0"
data-needle-end="99"
data-needle-width="3"
data-borders="true"
data-border-inner-width="0"
data-border-middle-width="0"
data-border-outer-width="10"
data-color-border-outer="#ccc"
data-color-border-outer-end="#ccc"
data-color-needle-shadow-down="#222"
data-border-shadow-width="0"
data-animation-target="plate"
data-animation-duration="1500"
data-value="45.5"
data-animate-on-init="true"
></canvas></center>
		ENDTEXT
		Insert Into ycurs Values (m.myvar)

		TEXT to m.myvar noshow
<center><br><br><canvas data-type="radial-gauge"
id="ycanvas"
data-width="500"
data-height="500"
data-min-value="0"
data-max-value="360"
data-major-ticks="N,NE,E,SE,S,SW,W,NW,N"
data-minor-ticks="22"
data-ticks-angle="360"
data-start-angle="180"
data-stroke-ticks="false"
data-highlights="false"
data-color-plate="#33a"
data-color-major-ticks="#f5f5f5"
data-color-minor-ticks="#ddd"
data-color-numbers="#ccc"
data-color-needle="rgba(240, 128, 128, 1)"
data-color-needle-end="rgba(255, 160, 122, .9)"
data-value-box="false"
data-value-text-shadow="false"
data-color-circle-inner="#fff"
data-color-needle-circle-outer="#ccc"
data-needle-circle-size="15"
data-needle-circle-outer="false"
data-animation-rule="linear"
data-needle-type="line"
data-needle-start="0"
data-needle-end="99"
data-needle-width="3"
data-borders="true"
data-border-inner-width="0"
data-border-middle-width="0"
data-border-outer-width="10"
data-color-border-outer="#ccc"
data-color-border-outer-end="#ccc"
data-color-needle-shadow-down="#222"
data-border-shadow-width="0"
data-animation-target="plate"
data-units="?"
data-title="DIRECTION"
data-font-title-size="19"
data-color-title="#f5f5f5"
data-animation-duration="1500"
></canvas></center>
		ENDTEXT
		Insert Into ycurs Values (m.myvar)

		TEXT to m.myvar noshow
<center><br><br><canvas data-type="radial-gauge"
id="ycanvas"
data-width="500"
data-height="500"
data-units="Km/h"
data-min-value="0"
data-max-value="220"
data-major-ticks="0,20,40,60,80,100,120,140,160,180,200,220"
data-minor-ticks="2"
data-stroke-ticks="true"
data-highlights='[
{"from": 160, "to": 220, "color": "rgba(200, 50, 50, .75)"}
]'
data-color-plate="#fff"
data-border-shadow-width="0"
data-borders="false"
data-needle-type="arrow"
data-needle-width="2"
data-needle-circle-size="7"
data-needle-circle-outer="true"
data-needle-circle-inner="false"
data-animation-duration="1500"
data-animation-rule="linear"
></canvas></center>
		ENDTEXT
		Insert Into ycurs Values (m.myvar)

		TEXT to m.myvar noshow
<center><br><br><canvas data-type="radial-gauge"
id="ycanvas"
data-width="500"
data-height="500"
data-units="Km/h"
data-min-value="0"
data-start-angle="90"
data-ticks-angle="180"
data-value-box="false"
data-max-value="220"
data-major-ticks="0,20,40,60,80,100,120,140,160,180,200,220"
data-minor-ticks="2"
data-stroke-ticks="true"
data-highlights='[
{"from": 160, "to": 220, "color": "rgba(200, 50, 50, .75)"}
]'
data-color-plate="#fff"
data-border-shadow-width="0"
data-borders="false"
data-needle-type="arrow"
data-needle-width="2"
data-needle-circle-size="7"
data-needle-circle-outer="true"
data-needle-circle-inner="false"
data-animation-duration="1500"
data-animation-rule="linear"
></canvas></center>
		ENDTEXT
		Insert Into ycurs Values (m.myvar)

		TEXT to m.myvar noshow
<center><br><br><canvas data-type="radial-gauge"
id="ycanvas"
data-width="500"
data-height="500"
data-units="Km/h"
data-min-value="0"
data-start-angle="0"
data-ticks-angle="180"
data-value-box="false"
data-max-value="220"
data-major-ticks="0,20,40,60,80,100,120,140,160,180,200,220"
data-minor-ticks="2"
data-stroke-ticks="true"
data-highlights='[{"from": 160, "to": 220, "color": "rgba(200, 50, 50, .75)"}]'
data-color-plate="#fff"
data-border-shadow-width="0"
data-borders="false"
data-needle-type="arrow"
data-needle-width="2"
data-needle-circle-size="7"
data-needle-circle-outer="true"
data-needle-circle-inner="false"
data-animation-duration="1500"
data-animation-rule="linear"
data-animation-target="plate"
></canvas></center>
		ENDTEXT
		Insert Into ycurs Values (m.myvar)

		TEXT to m.myvar noshow
<center><br><br><canvas data-type="radial-gauge"
id="ycanvas"
data-width="500"
data-height="500"
data-units= "PS"
data-min-value= "0"
data-max-value= "1000"
data-major-ticks=  "0,100,200,300,400,500,600,700,800,900,1000"
data-minor-ticks= "2"
data-ticks-angle= "270"
data-start-angle= "45"
data-stroke-ticks= "true"
data-highlights  = '[{ "from" :457,  "to" : 880, "color" : "rgba(78,   78, 76, 0.5)" }, {"from": 880,"to": 1000, "color" : "rgba(225, 7, 23, 0.75)" }]'
data-value-int= "1"
data-value-dec= "0"
data-color-plate= "#fff"
data-color-major-ticks= "#686868"
data-color-minor-ticks= "#686868"
data-color-title= "#000"
data-color-units= "#000"
data-color-numbers= "#686868"
data-value-box= "true"
data-color-value-text= "#000"
data-color-value-box-rect= "#fff"
data-color-value-box-rect-end= "#fff"
data-color-value-box-background= "#fff"
data-color-value-box-shadow= "false"
data-color-value-text-shadow="false"
data-color-needle-shadow-up= "true"
data-color-needle-shadow-down= "false"
data-color-needle= "rgba(200, 50, 50, .75)"
data-color-needle-end= "rgba(200, 50, 50, .75)"
data-color-needle-circle-outer= "rgba(200, 200, 200, 1)"
data-color-needle-circle-outer-end= "rgba(200, 200, 200, 1)"
data-border-shadow-width= "0"
data-borders= "true"
data-border-inner-width= "0"
data-border-middle-width= "0"
data-border-outer-width= "5"
data-color-border-outer= "#fafafa"
data-color-border-outer-end= "#cdcdcd"
data-needle-type= "arrow"
data-needle-width= "2"
data-needle-circle-size= "7"
data-needle-circle-outer= "true"
data-needle-circle-inner= "false"
data-animation-duration= "1500"
data-animation-rule= "dequint"
data-font-numbers= "Verdana"
data-font-title= "Verdana"
data-font-units= "Verdana"
data-font-value= "Led"
data-font-value-style= 'italic'
data-font-numbers-size= "20"
data-font-numbers-style= 'italic'
data-font-numbers-weight= 'bold'
data-font-title-size= "24"
data-font-vnits-Size= "22"
data-font-value-Size= "50"
data-animated-value: "true"
></canvas></center>
		ENDTEXT
		Insert Into ycurs Values (m.myvar)


		*!*dont work on ie11 but work on FF...i advised the corrected the author...bug corrected
		TEXT to m.myvar noshow
<center><br><br><canvas data-type="linear-gauge"
       id="ycanvas"
        data-width="160"
        data-height="600"
        data-border-radius="20"
        data-borders="true"
        data-bar-stroke-width="20"
        data-minor-ticks="10"
        data-major-ticks="0,10,20,30,40,50,60,70,80,90,100"
        data-color-numbers="red,green,blue,transparent,#ccc,#ccc,#ccc,#ccc,#ccc,#ccc,#ccc"
        data-color-major-ticks="red,green,blue,transparent,#ccc,#ccc,#ccc,#ccc,#ccc,#ccc,#ccc"
        data-color-bar-stroke="#444"
        data-value="22.3"
        data-units="?C"
        data-color-value-box-shadow="false"
        data-tick-side="left"
        data-number-side="left"
        data-needle-side="left"
        data-animate-on-init="true"
        data-color-plate="transparent"
        data-font-value-size="45"
></canvas></center>
		ENDTEXT
		Insert Into ycurs Values (m.myvar)

		TEXT to m.myvar noshow
<center><br><br>
<canvas data-type="linear-gauge"
       id="ycanvas"
        data-width="600"
        data-height="160"
        data-border-radius="20"
        data-borders="0"
        data-bar-stroke-width="0"
        data-value="66.6"
        data-tick-side="left"
        data-number-side="left"
        data-needle-side="left"
        data-animation-rule="bounce"
        data-animation-duration="750"
        data-title="Temperature"
        data-units="°C"
></canvas></center>
		ENDTEXT
		Insert Into ycurs Values (m.myvar)

		Sele ycurs
		*brow
		Locate
	Endproc

	Procedure Destroy
		Erase Addbs(Sys(2023))+"ytemp.html"
		m.yrep=Null
		Release m.yrep
		Clea Events
	Endproc

	Procedure olecontrol1.Init
		This.silent=.T.
	Endproc

Enddefine
*
*-- EndDefine:yGauges

Define Class ycont As Container
	Anchor = 768
	Top = 5
	Left = 8
	Width = 937
	Height = 61
	BackStyle = 0
	ToolTipText = ""
	Name = "Container1"

	Add Object text1 As TextBox With ;
		FontBold = .T., ;
		FontSize = 12, ;
		Alignment = 3, ;
		Value = 70, ;
		Height = 25, ;
		Left = 724, ;
		ToolTipText = "Angle", ;
		Top = 20, ;
		Width = 71, ;
		ForeColor = Rgb(255,0,0), ;
		BackColor = Rgb(128,255,255), ;
		Name = "Text1"

	Add Object command1 As CommandButton With ;
		Top = 20, ;
		Left = 796, ;
		Height = 25, ;
		Width = 62, ;
		FontBold = .T., ;
		Caption = "Animate", ;
		MousePointer = 15, ;
		BackColor = Rgb(255,128,64), ;
		Name = "Command1"

	Add Object label1 As Label With ;
		AutoSize = .T., ;
		FontBold = .T., ;
		FontName = "Webdings", ;
		FontSize = 36, ;
		BackStyle = 0, ;
		Caption = "4", ;
		Height = 51, ;
		Left = 70, ;
		MousePointer = 15, ;
		Top = 8, ;
		Width = 51, ;
		ForeColor = Rgb(0,255,0), ;
		ToolTipText = "Next bgauge", ;
		Name = "Label1"

	Add Object label2 As Label With ;
		AutoSize = .T., ;
		FontBold = .T., ;
		FontName = "Webdings", ;
		FontSize = 36, ;
		BackStyle = 0, ;
		Caption = "3", ;
		Height = 51, ;
		Left = 8, ;
		MousePointer = 15, ;
		Top = 8, ;
		Width = 51, ;
		ForeColor = Rgb(0,255,0), ;
		ToolTipText = "Previous gauge", ;
		Name = "Label2"

	Add Object timer1 As Timer With ;
		Top = 25, ;
		Left = 154, ;
		Height = 23, ;
		Width = 23, ;
		Enabled = .F., ;
		Interval = 2000, ;
		Name = "Timer1"

	Add Object command2 As CommandButton With ;
		Top = 20, ;
		Left = 860, ;
		Height = 25, ;
		Width = 73, ;
		FontBold = .T., ;
		FontSize = 10, ;
		Caption = "Random...", ;
		MousePointer = 15, ;
		ToolTipText = "Random animation", ;
		BackColor = Rgb(128,255,0), ;
		Name = "Command2"

	Add Object shape3 As Shape With ;
		Top = 25, ;
		Left = 654-20, ;
		Height = 17, ;
		Width = 17, ;
		Curvature = 99, ;
		MousePointer = 15, ;
		BackColor = Rgb(0,255,0), ;
		tooltiptext="linear gauge test", ;
		Name = "Shape3"

	Add Object shape1 As Shape With ;
		Top = 25, ;
		Left = 654, ;
		Height = 17, ;
		Width = 17, ;
		Curvature = 99, ;
		MousePointer = 15, ;
		BackColor = Rgb(0,255,0), ;
		tooltiptext="Radial gauge animation", ;
		Name = "Shape1"

	Add Object shape2 As Shape With ;
		Top = 25, ;
		Left = 686, ;
		Height = 17, ;
		Width = 17, ;
		Curvature = 99, ;
		MousePointer = 15, ;
		ToolTipText = "Capture gauge", ;
		BackColor = Rgb(255,0,0), ;
		Name = "Shape2"

	*
	Add Object yhelp As Label With ;
		AutoSize = .T.,;
		FontBold = .T.,;
		FontSize = 24,;
		BackStyle = 0,;
		Caption = "?",;
		Height = 40,;
		Left = 625-20,;
		MousePointer = 15,;
		Top = 16,;
		Width = 22,;
		ForeColor = Rgb(255,0,0),;
		ToolTipText = "Help",;
		Name = "yHelp"

	Procedure yhelp.Click
		Local m.myvar
		TEXT to m.myvar pretext 7 noshow
	This is a set of 10 javascripts tests of javascript gauges from https://github.com/Mikhus/canvas-gauges.
its licencied under MIT (read the Github project).
the codes are gathered in a vfp cursor and the form can rotates all the gauges contained.
each gauge is drawn on an html5 canvas and rendered.it can be animated with any angle set or by random one.a timer animates the gauge at starting.
note that the gauge can be rendered as well with gdiplusX library.
can capture the gauge area with the red shape to a png image (in source folder) for gauge1-9.
the canvas uses the canvas method  toDataUrl to achieve this option(as well as gdiplusX imgcanvas.oBMP.save method).
can click the arrows (next-preview) buttons or the commandbuttons to run any gauge of the 9 ones and the green shape to run the special 10 one animated.
can download the project from Github and run it on disc(offline).
i tested the linear gauges but infortunatly does not work on IE11(or emulation).....update:ok ,bug corrected by the author.
of course internet must be connected to access the gauge.js file and background image.
		ENDTEXT
		Messagebox(m.myvar,0+32+4096,'Gauges')
	Endproc


	Procedure text1.Valid
		This.Parent.command1.Click
	Endproc

	Procedure command1.Click
		Try
			With Thisform.olecontrol1.Document
				.getElementById("gauge-value").Value=This.Parent.text1.Value
				.getElementById("yb").Click(.T.)
			Endwith
		Catch
		Endtry
	Endproc

	Procedure label1.Click
		Sele ycurs
		If !Eof()
			Skip
		Else
			Locate
		Endi
		Thisform.ybuild(Code)
	Endproc

	Procedure label2.Click
		Sele ycurs
		If !Bof()
			Skip-1
		Else
			Go Botto
		Endi
		Thisform.ybuild(Code)
	Endproc

	Procedure timer1.Timer
		This.Parent.command1.Click
		This.Enabled=.F.
	Endproc

	Procedure command2.Click
		Local m.max
		Do Case
			Case Recno()=1
				m.max=50
			Case Between(Recno(),2,5)
				m.max=359
			Case Between(Recno(),6,8)
				m.max=220
			Case Recno()=9
				m.max=1000
			Otherwise
				m.max=50
		Endcase
		Rand(-1)
		Local m.rd
		m.rd=Int((m.max ) * Rand( ) + 1)
		Try
			With Thisform.olecontrol1.Document
				.getElementById("gauge-value").Value=m.rd
				.getElementById("yb").Click(.T.)
			Endwith
		Catch
		Endtry
	Endproc

	Procedure shape1.Click
		With Thisform.container1
			.text1.Enabled=.F.
			.command1.Enabled=.F.
			.command2.Enabled=.F.
			.shape2.Enabled=.F.
		Endwith

		Local m.myvar
		TEXT to m.myvar noshow
<!doctype html>
<html>
<head>
<meta http-equiv="Content-Type" content="text/html; charset=UTF-8">
<title>Gauge Test</title>
<style>body {
padding: 0;
margin: 0;
background-color:black; background:url('https://s-media-cache-ak0.pinimg.com/originals/e1/a0/ef/e1a0ef685ab2c885a3b837db6f6ebd6d.gif') repeat;
}
</style>
</head>
<body>

<center>  <button  onclick="animateGauges()">Animate</button>
<button  onclick="stopGaugesAnimation()">Stop animation</button>
</center>

<hr>
<br><br><br><br><br><center>
<canvas data-type="radial-gauge"
data-value="-20"
data-width="300"
data-height="300"
data-bar-width="10"
data-bar-shadow="5"
data-color-bar-progress="rgba(50,200,50,.75)"
></canvas>

<canvas data-type="radial-gauge"
data-value="-20"
data-width="300"
data-height="300"
data-bar-width="2"
data-bar-shadow="0"
data-border-inner-width="0"
data-border-outer-width="0"
data-border-middle-width="0"
data-color-bar-progress="rgba(50,50,200,.75)"
data-color-bar="#aae"
data-color-needle="rgba(50,50,200,.75)"
data-color-needle-end="#aae"
data-highlights="false"
data-value-box-border-radius="0"
data-value-box-stroke="1"
data-color-value-box-shadow="0"
data-needle-type="line"
data-needle-width="1"
data-needle-circle-size="5"
data-needle-circle-inner="false"
data-color-needle-circle-outer="rgba(50,50,200,.75)"
data-color-needle-circle-outer-end="#aae"
data-stroke-ticks="0"
></canvas>

<canvas data-type="radial-gauge"
data-value="-20"
data-width="300"
data-height="300"
data-bar-width="20"
data-bar-shadow="1"
data-color-bar-progress="rgba(200,50,50,.75)"
data-color-bar="#eaa"
data-border-shadow-width="0"
data-border-inner-width="0"
data-border-outer-width="0"
data-border-middle-width="0"
data-highlights="false"
data-value-box-stroke="0"
data-color-value-box-shadow="0"
data-value-box-border-radius="0"
data-value-text-shadow="0"
data-color-value-box-background="transparent"
data-needle="false"
></canvas>
</center>

<script src="https://rawgit.com/Mikhus/canvas-gauges/v2.1.2/gauge.min.js"></script>
<script>
if (!Array.prototype.forEach) {
Array.prototype.forEach = function(cb) {
var i = 0, s = this.length;
for (; i < s; i++) {
	cb && cb(this[i], i, this);
}
}
}

document.fonts && document.fonts.forEach(function(font) {
font.loaded.then(function() {
if (font.family.match(/Led/)) {
	document.gauges.forEach(function(gauge) {
		gauge.update();
	});
}
});
});

var timers = [];

function animateGauges() {
document.gauges.forEach(function(gauge) {
timers.push(setInterval(function() {
	var min = gauge.options.minValue - 20;
	var max = gauge.options.maxValue + 20;

	gauge.value = min + Math.random() * (max - min);
}, gauge.animation.duration + 50));
});
}

function stopGaugesAnimation() {
timers.forEach(function(timer) {
clearInterval(timer);
});
}
</script>
</body>
</html>
		ENDTEXT
		Local m.lcdest
		m.lcdest=Addbs(Sys(2023))+"ytemp.html"
		Strtofile(m.myvar,m.lcdest)
		Thisform.olecontrol1.Navigate(m.lcdest)
		Retu
	Endproc

	Procedure shape2.Click
		oo=Thisform.olecontrol1.Document.getElementById("ycanvas")
		Local m.x,m.y,mlcdest
		m.y=Substr(oo.toDataUrl("image/png",0.92)	,22)
		m.x=Strconv(m.y,14)
		m.lcdest=m.yrep+"ycaptured_"+Sys(2015)+".png"
		Strtofile(m.x,m.lcdest)
		Run/N explorer  &lcdest
	Endproc

	Procedure shape3.Click  &&the IE11 bug corrected by the author:https://github.com/Mikhus/canvas-gauges/commit/d7fce9b1c9e98d428da31083fcc27bfdaab0a40a
		With Thisform.container1
			.text1.Enabled=.F.
			.command1.Enabled=.F.
			.command2.Enabled=.F.
			.shape2.Enabled=.F.
		Endwith

		Local m.myvar
		TEXT to m.myvar noshow
<!doctype html>
<html>
<head>
    <meta http-equiv="Content-Type" content="text/html; charset=UTF-8">
    <title>Gauge Test</title>
    <script src="https://rawgit.com/Mikhus/canvas-gauges/v2.1.2/gauge.min.js"></script>
</head>
<body style="background:#222">

<button onclick="animateGauges()">Animate</button>
<button onclick="stopGaugesAnimation()">Stop animation</button>

<hr>

<canvas data-type="linear-gauge"
        data-width="160"
        data-height="600"
        data-border-radius="20"
        data-borders="true"
        data-bar-stroke-width="20"
        data-minor-ticks="10"
        data-major-ticks="0,10,20,30,40,50,60,70,80,90,100"
        data-color-numbers="red,green,blue,transparent,#ccc,#ccc,#ccc,#ccc,#ccc,#ccc,#ccc"
        data-color-major-ticks="red,green,blue,transparent,#ccc,#ccc,#ccc,#ccc,#ccc,#ccc,#ccc"
        data-color-bar-stroke="#444"
        data-value="22.3"
        data-units="°C"
        data-color-value-box-shadow="false"
        data-tick-side="left"
        data-number-side="left"
        data-needle-side="left"
        data-animate-on-init="true"
        data-color-plate="transparent"
        data-font-value-size="45"
></canvas>

<canvas data-type="linear-gauge"
        data-width="160"
        data-height="600"
        data-border-radius="20"
        data-borders="0"
        data-bar-stroke-width="0"
        data-minor-ticks="20"
        data-animation-rule="cycle"
        data-animation-duration="1000"
        data-title="Temperature"
        data-units="°C"
        data-color-value-box-shadow="false"
        data-animated-value="true"
></canvas>

<canvas data-type="linear-gauge"
        data-width="160"
        data-height="600"
        data-border-radius="0"
        data-borders="0"
        data-bar-begin-circle="25"
        data-minor-ticks="10"
        data-value="36.6"
        data-min-value="35"
        data-max-value="42"
        data-title="°C"
        data-major-ticks="35,36,37,38,39,40,41,42"
        data-ticks-width="18"
        data-ticks-width-minor="7.5"
        data-bar-width="5"
        data-highlights="false"
        data-color-value-box-shadow="false"
        data-value-box-stroke="0"
        data-color-value-box-background="false"
        data-value-int="2"
        data-value-dec="1"
></canvas>

<canvas data-type="linear-gauge"
        data-width="160"
        data-height="600"
        data-border-radius="20"
        data-borders="0"
        data-bar-begin-circle="false"
        data-title="Temperature"
        data-units="°C"
        data-minor-ticks="10"
        data-value="99"
        data-major-ticks="0,10,20,30,40,50,60,70,80,90,100"
        data-tick-side="right"
        data-number-side="right"
        data-needle-side="right"
        data-animation-rule="bounce"
        data-animation-duration="750"
        data-bar-stroke-width="5"
        data-value-box-border-radius="0"
        data-value-text-shadow="false"
></canvas>

<br>

<canvas data-type="linear-gauge"
        data-width="600"
        data-height="160"
        data-border-radius="0"
        data-borders="0"
        data-bar-begin-circle="false"
        data-title="Temperature"
        data-units="°C"
        data-value="75.5"
        data-bar-stroke-width="5"
        data-highlights='[{"from":50, "to":75, "color": "red"}]'
></canvas>

<br>

<canvas data-type="linear-gauge"
        data-width="600"
        data-height="160"
        data-border-radius="20"
        data-borders="0"
        data-bar-stroke-width="0"
        data-value="66.6"
        data-tick-side="left"
        data-number-side="left"
        data-needle-side="left"
        data-animation-rule="bounce"
        data-animation-duration="750"
        data-title="Temperature"
        data-units="°C"
></canvas>

<canvas data-type="linear-gauge"
        data-width="400"
        data-height="150"
        data-min-value="0"
        data-max-value="220"
        data-major-ticks="0,20,40,60,80,100,120,140,160,180,200,220"
        data-minor-ticks="2"
        data-stroke-ticks="true"
        data-highlights='false'
        data-color-plate="#fff"
        data-border-shadow-width="0"
        data-borders="false"
        data-bar-begin-circle="false"
        data-bar-width="10"
        data-tick-side="left"
        data-number-side="left"
        data-needle-side="left"
        data-needle-type="line"
        data-needle-width="3"
        data-color-needle="#222"
        data-color-needle-end="#222"
        data-animation-duration="1500"
        data-animation-rule="linear"
        data-animation-target="plate"
></canvas>
<script>
if (!Array.prototype.forEach) {
    Array.prototype.forEach = function(cb) {
        var i = 0, s = this.length;
        for (; i < s; i++) {
            cb && cb(this[i], i, this);
        }
    }
}

var timers = [];

function animateGauges() {
    document.gauges.forEach(function(gauge) {
        timers.push(setInterval(function() {
            gauge.value = Math.random() *
                (gauge.options.maxValue - gauge.options.minValue) +
                gauge.options.minValue;
        }, gauge.animation.duration + 500));
    });
}

function stopGaugesAnimation() {
    timers.forEach(function(timer) {
        clearInterval(timer);
    });
}
</script>
</body>
</html>
		ENDTEXT
		Local m.lcdest
		m.lcdest=Addbs(Sys(2023))+"ytemp.html"
		Strtofile(m.myvar,m.lcdest)
		Thisform.olecontrol1.Navigate(m.lcdest)
		Retu
	Endproc


Enddefine
*
*-- EndDefine: ycont


Note :in same registry ,i published in Foxite (2013) a set of flash gauges,as FusionChart demos,can be downloaded at:
https://www.foxite.com/uploads/dcb6d2d6-234b-4ffb-9f80-e3e2460f9383.zip

*Important:All Codes above are tested on VFP9SP2 & windows 10 pro and IE11 emulation.