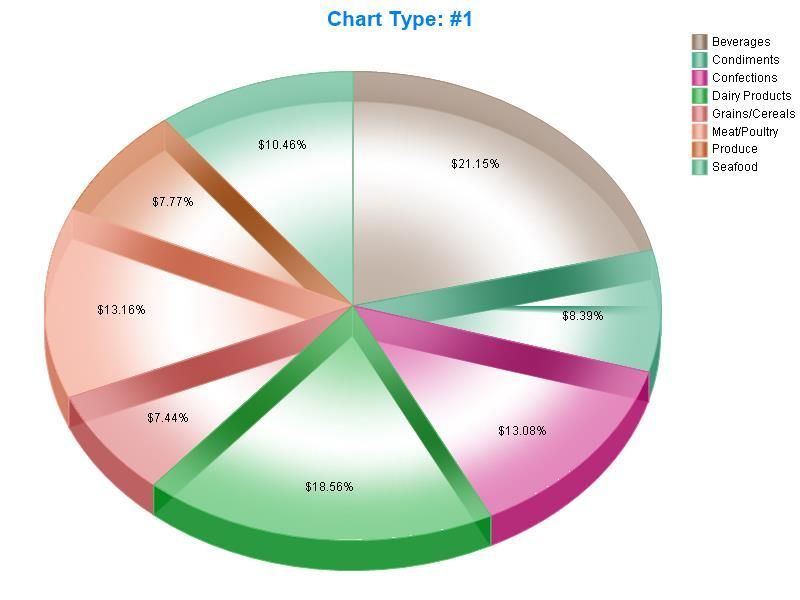
yFoxChart using foxchart VFP class
The original class of foxchart is in vfpx codeplex and can be downloaded from this site.The author of this admirable work is Cesar Schalom (Brazil).
I worked on this class on year 2009 and I joigned the old version i used of this class to the download zip.
This download contains all the files needed to run the application as i tested it with the current versions of :
-System.app (gdiplusX)
-Foxchart class source
It contains also the exe file generated in vfp9SP2.You can generate yours with the project include.
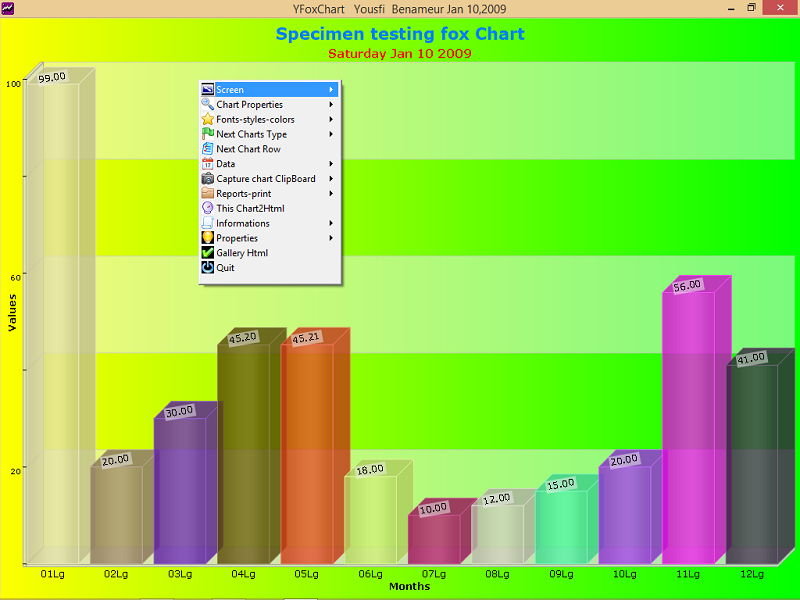
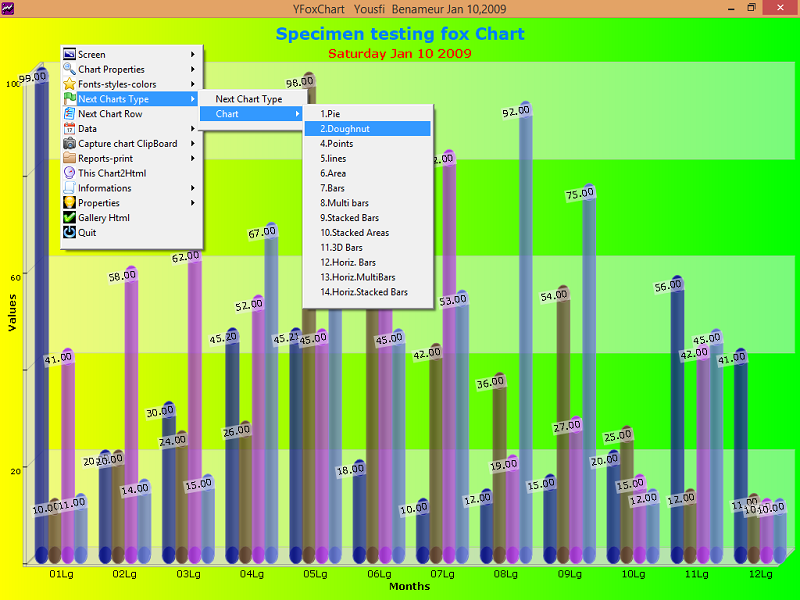
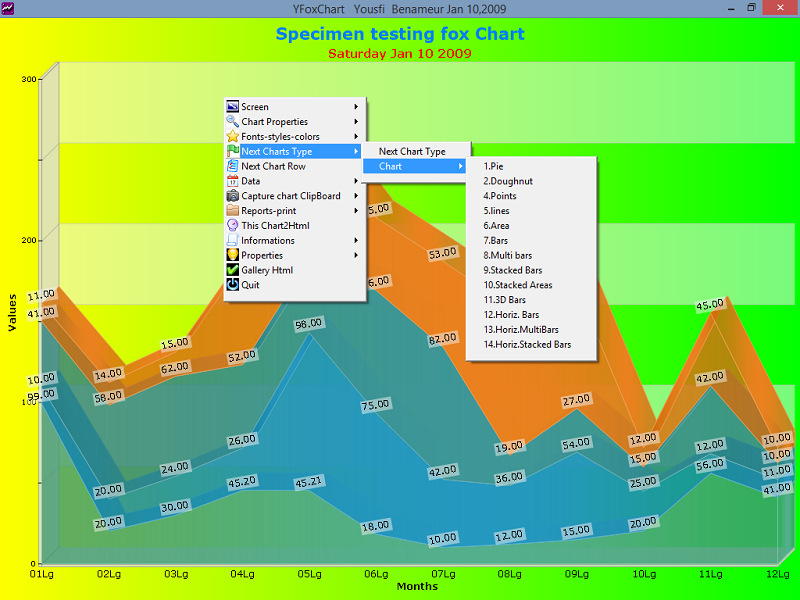
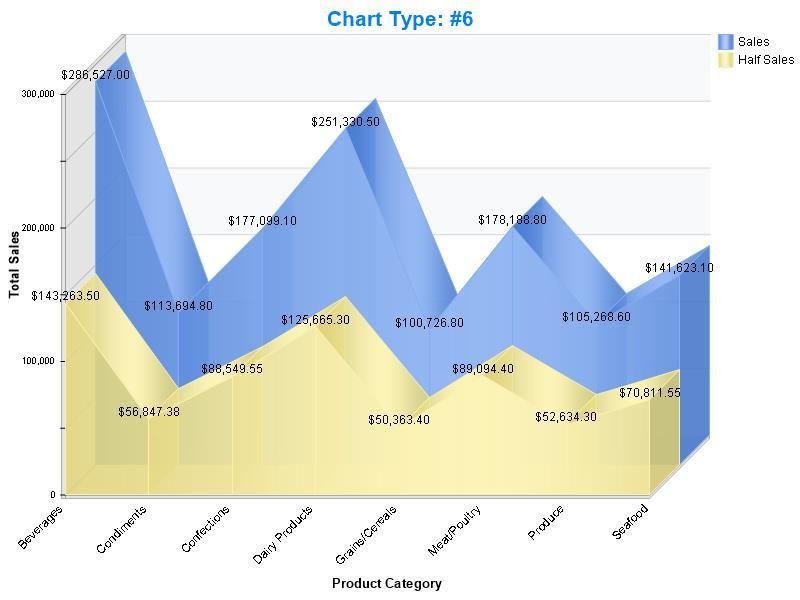
The code implement an instance of the class and run a form with all commands only in a contextuel menu.
This menu drives all process of the foxchart class visually .
Maybe with the various mehods and properties of this class i forget somethings.i
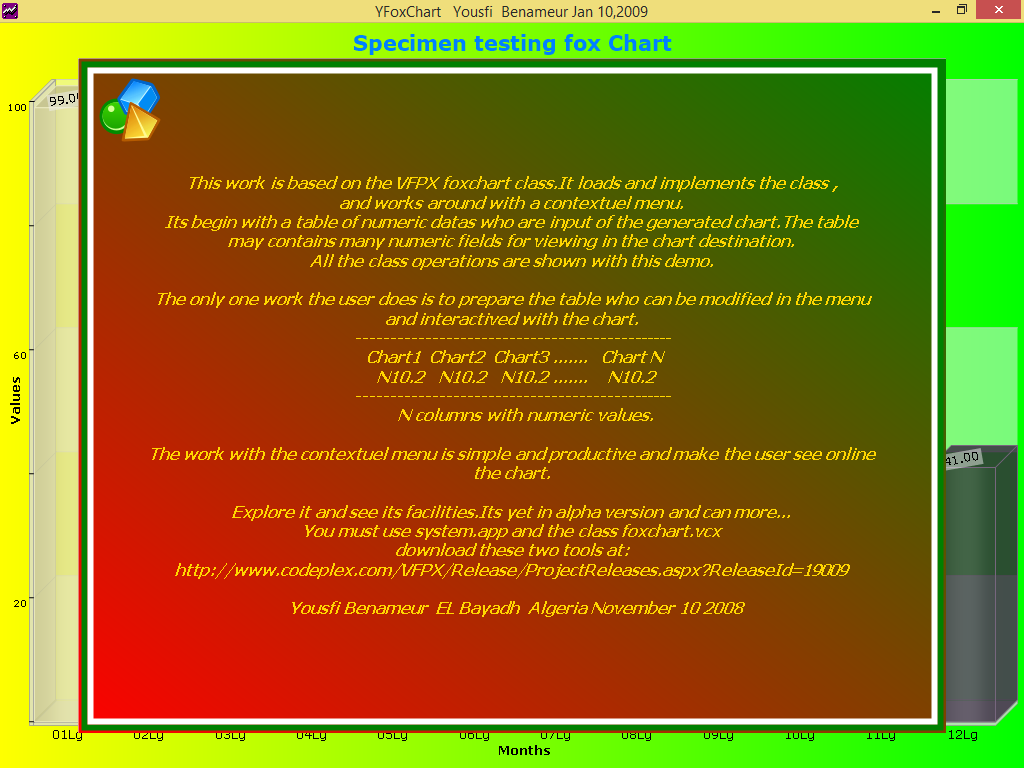
for more,read the menu item "information" before start .
link to download:
http://www.foxite.com/downloads/default.aspx?id=196&keyword=foxchart&category=
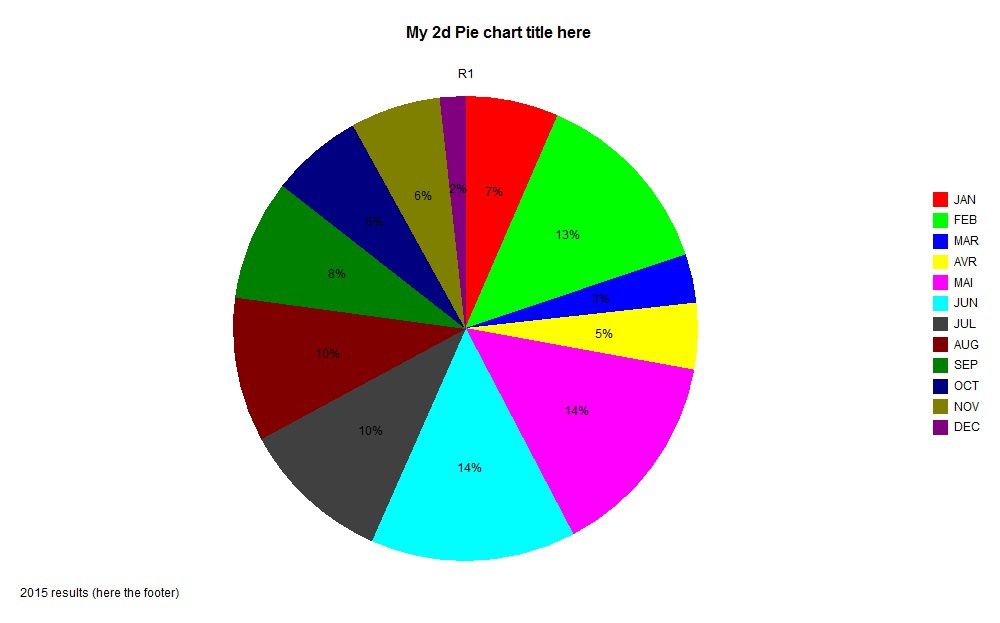
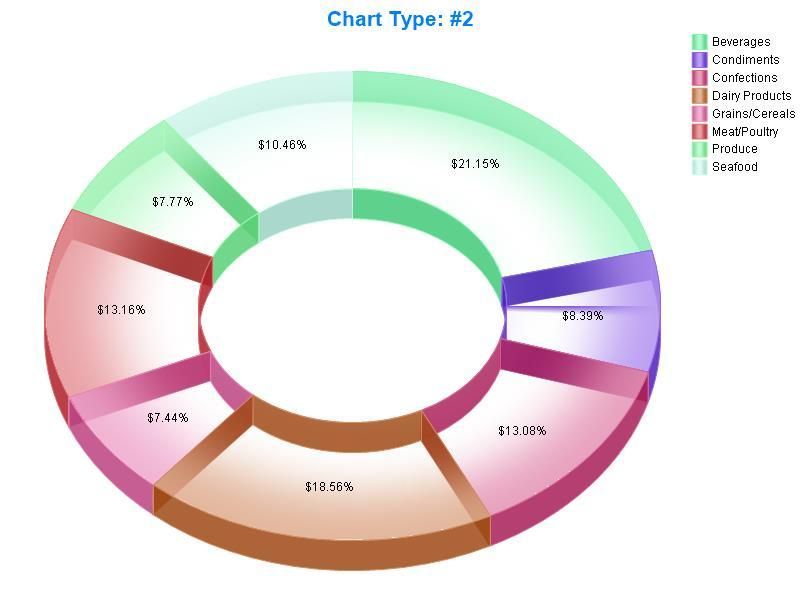
added a code *2* for working with MSchart.ocx (pie chart)
![]() This page was last updated on : lundi 23 février 2015; 01:40:49
This page was last updated on : lundi 23 février 2015; 01:40:49
the download page of recent stable versions of foxchart in codeplex is:
https://vfpx.codeplex.com/releases/view/106904
can adapt with some works this application to newest updated classes.
/http%3A%2F%2Fwww.foxite.com%2Fmugs%2Ffoxonly.gif)
The zip to download is from Foxite the house of vfp developpers.


Click on code to select [then copy] -click outside to deselect
 *2* draw a pie chart of MSChart activeX
*added on Thursday 10 march 2016
Publi yform
yform=Newobject("ychart")
yform.Show
Read Events
Retu
*
Define Class ychart As Form
Height = 650
Width = 900
ShowWindow = 2
AutoCenter = .T.
Caption = "MSChart"
Name = "Form1"
Add Object simplechart1 As simplechart With ;
Top = 0, ;
Left = 0, ;
Height = 528, ;
Width = 876, ;
Anchor = 15, ;
Name = "Simplechart1"
Add Object combo1 As ComboBox With ;
FontSize = 10, ;
Anchor = 768, ;
Height = 25, ;
Left = 204, ;
Top = 549, ;
Width = 136, ;
Name = "Combo1"
Add Object command1 As CommandButton With ;
Top = 549, ;
Left = 360, ;
Height = 25, ;
Width = 97, ;
FontBold = .T., ;
FontSize = 10, ;
Anchor = 768, ;
Caption = "Capture chart", ;
BackColor = Rgb(128,255,0), ;
Name = "Command1"
Procedure Init
Thisform.AddObject("yhelp1","yhelp")
Thisform.yhelp1.Visible=.T.
With Thisform.simplechart1
.cAlias="ycurs"
.cData="c1,c2,c3,c4,c5,c6,c7,c8,c9,c10,c11,c12"
.cTitle="My 2d Pie chart title here"
.ShowLegend=.T.
.cLabels="JAN,FEB,MAR,AVR,MAI,JUN,JUL,AUG,SEP,OCT,NOV,DEC"
.cFootnote="2015 results (here the footer)"
*additional properties to set for 2dPie chart
.Anchor=15
.chartType=14 &&2Dpie
.Column=1
.ColumnCount=12
.columnLabelcount=12
.columnLabelIndex=1
.rowCount=1
.RowLabelcount=12
.Seriescolumn=1
.Seriestype=24 &&2dPie
.ShowLegend=.T.
.createChart()
Endwith
Thisform.combo1.InteractiveChange()
Endproc
Procedure Load &&create your cursor embedding data here (or select... from a physical table)
Create Cursor ycurs (c1 N(10,2),c2 N(10,2),c3 N(10,2),c4 N(10,2),c5 N(10,2),c6 N(10,2),c7 N(10,2),c8 N(10,2),c9 N(10,2),c10 N(10,2),c11 N(10,2),c12 N(10,2))
Insert Into ycurs Values(50000*Rand(),50000*Rand(),50000*Rand(),50000*Rand(),50000*Rand(),50000*Rand(),50000*Rand(),50000*Rand(),50000*Rand(),50000*Rand(),50000*Rand(),50000*Rand())
Sele ycurs
*brow
Endproc
Procedure combo1.InteractiveChange
#Define VtChLabelComponentValue 1 && The value of the data point appears in the label.
#Define VtChLabelComponentPercent 2 && The value of the data point is displayed in the label as a percentage of the total value of the series.
#Define VtChLabelLocationTypeInside 5 && Label Location - Inside pie or doughnut
#Define VtChLabelLocationTypeOutside 6 && Label Location - Outside pie or doughnut
*write data on chart
Do Case
Case This.Value=1
For Each obj In Thisform.simplechart1.Plot.SeriesCollection
With obj.Datapoints.Item(-1).DatapointLabel
.Component = VtChLabelComponentValue &&show values
.LocationType = VtChLabelLocationTypeInside && Inside pie slice
Endwith
Endfor
Case This.Value=2
For Each obj In Thisform.simplechart1.Plot.SeriesCollection
With obj.Datapoints.Item(-1).DatapointLabel
.Component = VtChLabelComponentPercent && Show as percent
.LocationType = VtChLabelLocationTypeInside && Inside pie slice
.PercentFormat = '0%'
Endwith
Endfor
Endcase
Wait Window "Adjust dimensions chart by resizing form" Timeout 1
Endproc
Procedure combo1.Init
With This
.AddItem("Values on 2dPie")
.AddItem("% on 2dPie")
.ListIndex=1
.Value=1
.Style=2
Endwith
Endproc
Procedure command1.Click &&capture chart as image in MSPAINt (can save as png,jpg,bmp,gif.....)
Thisform.simplechart1.editCopy()
oshell=Createobject("wscript.shell")
Thisform.WindowState=1
Run/N "mspaint"
Inkey(2)
oshell.sendKeys('^{v}')
Inkey(2)
Thisform.WindowState=0
Endproc
Procedure Destroy
Dele File Addbs(Sys(2023))+"ytemp.txt" &&clean
Clea Events
Endproc
Enddefine
*
*-- EndDefine: ychart
*this is the class charts.vcx as prg below
*if you uncomment the 2 lines at the top (set classlib to ..), this is not needed.charts.vcx then must be in source folder
*if want to have 1 prg, then use this code below as class)
*SimpleChart class. Written by Mike Lewis (Mike Lewis Consultants class Ltd.), February - March 2002. as vcx/vct
*converted as flat text class
Define Class simplechart As OleControl
OleClass="MSChart20Lib.MSChart.2"
Height = 246
Width = 274
Visible = .F.
*-- Alias of cursor or open table which contains the data for the chart
cAlias = ""
*-- Comma-separated list of the fields within the cursor which contain the data for the columns of the chart
cData = ""
*-- Comma-separated list of column labels; used for legend (if any)
cLabels = ""
*-- Name of field within the cursor which holds the row labels.
crowlabels = ""
*-- Comma-separated list of names of colours to use for bars or lines (e.g. Red, Blue, White)
ccolours = ""
*-- Chart's main title
cTitle = ""
*-- Text of chart's footnote
cFootnote = ""
Name = "simplechart"
*-- Says whether to ignore any zero data points
lignorezero = .F.
*-- Says whether to show markers in the chart
lshowmarkers = .F.
*-- Call this to create or update the chart, using data from the cursor
Procedure createChart
* This does all the work needed to create or update the chart.
* It uses data from a cursor or an open table whose alias is stored
* in the cAlias property.
* To create a chart, follow these steps:
* - Fill a cursor or table with the data to be graphed.
* - Set cAlias to the alias of this cursor or table
* - In cData, place a comma-delimited list of the fields from the
* cursor whose values you want to plot (these must be numeric)
* - In cRowLabels, store the name of the field from the cursor
* which contains the row labels (if any).
* - In cLabels, store a comma-delimited list of the labels to be used
* for the legend; these must correspond one-to-one with the field names
* in cData.
* - Set other properties as necessary.
* - Call this method.
* For further information, see the Documentation method.
* The method performs simple error-checking, and returns .F. if the cAlias
* or cData properties are invalid
Local lnFieldCount, lnCol, lnRow, lnLabCount, lnItem, lnI
Local lcColStr, lcColVal, lcRed, lcGreen, lcBlue
Local lnColIndex, lnColsToSet, lnRed, lnBlue, lnGreen
With This
* Keep the chart invisible while it is being constructed
.Visible = .F.
* Preliminary error-checking. If any of these checks fails,
* just exit without doing anything
* Check presence of cursor
If Empty(.cAlias) Or Not Used(.cAlias)
Return .F.
Endif
Select (.cAlias)
* Check that the list of data fields is present
If Empty(.cData)
Return .F.
Endif
lnFieldCount = Alines(laData,Strtran(.cData,",",Chr(13)))
&& the above line will fill an array with names of the fields
&& to be plotted; lnFieldCount will hold the number of fields
If lnFieldCount = 0
Return .F.
Endif
.ColumnCount = lnFieldCount
.rowCount = 0
* scan the cursor, filling the data points as we go
Count For Not Deleted() To .rowCount
lnRow = 1
Scan For Not Deleted()
.Row = lnRow
* Fill data points for this record
For lnCol = 1 To lnFieldCount
.Column = lnCol
lnItem = Evaluate(laData(lnCol))
If lnItem>0 Or Not .lignorezero
.Data = lnItem
Endif
Endfor
* Fill the row label for this record
If Not Empty(.crowlabels)
.rowLabel = Evaluate(.crowlabels)
Endif
lnRow = lnRow+1
Endscan
* Set the legend captions
If Not Empty(.cLabels)
* Unpack the labels
lnLabCount = Alines(laLabs,Strtran(.cLabels,",",Chr(13)))
&& This will fill the laLabs array with the labels
For lnCol = 1 To lnFieldCount
If lnCol <= lnLabCount
.Column = lnCol
.columnLabel = laLabs(lnCol)
Endif
Endfor
Endif
* Show markers (if required)
For lnI = 1 To .ColumnCount
.Plot.SeriesCollection(lnI).SeriesMarker.Show = .lshowmarkers
Endfor
* Deal with colours
If Not Empty(.ccolours)
* Create arrays containing the colour names and corresponding values
lcColStr = "red, green, blue, black, white, grey, gray, yellow, brown, magenta, cyan, darkblue, darkgreen"
lcColVal = "255, 65280, 16711680,0, 16777215,8421504,8421504,65535, 128, 16711935,16776960, 8388608, 32768"
&& the above are 24-bit integer values, and are included for reference only
lcRed = "255, 0, 0, 0, 255, 128, 128, 255, 128, 255, 0, 0, 0"
lcGreen = "0, 255, 0, 0, 255, 128, 128, 255, 128, 0, 255, 0, 128"
lcBlue = "0, 0, 255, 0, 255, 128, 128, 0, 0, 255, 255, 128, 0"
Alines(lacolStr,Strtran(lcColStr,",",Chr(13)),.T.)
Alines(lacolVal,Strtran(lcColVal,",",Chr(13)),.T.)
Alines(laRed,Strtran(lcRed,",",Chr(13)),.T.)
Alines(laGreen,Strtran(lcGreen,",",Chr(13)),.T.)
Alines(laBlue,Strtran(lcBlue,",",Chr(13)),.T.)
&& ALINES() only valid in VFP 6.0 and above
* Put the list of required colours into an array
.ccolours = Lower(.ccolours)
lnColsToSet = Alines(laReqCols,Strtran(.ccolours,",",Chr(13)),.T.)
lnColsToSet = Min(lnColsToSet,.ColumnCount)
&& We need to process the number of colours passed, or the number of
&& columns in the chart, whichever is lower
* Loop through the columns, setting the colours as required
For lnI = 1 To lnColsToSet
* Locate this column's required colour in the colour name array
lnColIndex = Ascan(lacolStr,laReqCols(lnI))
If lnColIndex > 0
* Determine the red, green and blue elements
lnRed = Val(laRed(lnColIndex))
lnGreen = Val(laGreen(lnColIndex))
lnBlue = Val(laBlue(lnColIndex))
* Set the bar's colours
.Plot.SeriesCollection(lnI).Datapoints(-1).Brush.FillColor.Set(lnRed,lnGreen,lnBlue)
* Set colours for line series
.Plot.SeriesCollection(lnI).Pen.vtColor.Set(lnRed,lnGreen,lnBlue)
Endif
Endfor
Endif
* Deal with title and footnote
If Not Empty(.cTitle)
.Title.Text = .cTitle
.Title.VtFont.Name = "Arial"
.Title.VtFont.Size = 12
.Title.VtFont.Style = 1 && bold
Endif
If Not Empty(.cFootnote)
.Footnote.Text = .cFootnote
Endif
* Make the chart visible
.Visible = .T.
Endwith
Return .T.
Endproc
*-- Read this to learn how to use this class.
Procedure documentation
* Documentation for the class. Not intended to be executed.
Return
Endproc
Enddefine
*
*-- EndDefine: simplechart
Define Class yhelp As Label
AutoSize = .T.
FontSize = 18
Anchor = 768
BackStyle = 0
Caption = "?"
Height = 30
Left = 468
MousePointer = 15
Top = 544
Width = 15
ForeColor = Rgb(0,255,0)
Name = "Label1"
Procedure Click
TEXT to m.myvar textmerge noshow
Method:simpleChart1.Documentation
*******************************************************************
*SimpleChart class. Written by Mike Lewis (Mike Lewis Consultants *
*Ltd.), February - March 2002. *
*******************************************************************
Copyright Mike Lewis Consultants Ltd. All rights Reserved.
Feel Free To Use This Class In Any way you Like, but please
Do Not Remove our Copyright notice Or the following disclaimer:
Although we have tested This Class thoroughly, we cannot Accept
Any legal liability For its Use. Do Not Use This Class unless you
are satisfied that it works correctly In your Application.
we welcome your feedback. please email Mike Lewis At mikl@compuserve.com
Or see www.ml-consult.co.uk
What does it Do?
the SimpleChart Class produces two- And three-dimensional charts
And graphs, using Data From a Visual FoxPro Table Or Cursor.
What Do I need?
the Class Is based On Microsoft's MSChart ActiveX control
(MSChrt20.Ocx), which comes With VFP 6.0 And 7.0. To Use the
Class, you will need the ActiveX Control To be installed On your
own computer. To distribute applications which Use the Class,
you will need To ensure that the Ocx File Is present And
properly registered On the End-User's computer.
How Do I Use it?
the First Step Is To provide a Table Or Cursor which contains
the Data required For your chart. Then Drop the Class On a VFP
Form, Set certain properties, And Finally Call its CreateChart
Method.
the Cursor
the chart Is Always populated With Data From a Cursor (Or
Table). you can Use an existing Cursor If it already contains
the required Data, Or you can Create one specifically For This
purpose.
the Cursor must have the following characteristics:
- a Record For Each Data Point On the chart.
- a Field For Each Of the series On the chart. These Fields must
be numeric.
- Optionally, a Field containing the Row Label For the Current
Record. This Field must be a Character String.
As an example, suppose you wanted To plot monthly sales Value
And monthly sales quantity For the Year To Date. your Cursor might Look
something Like This:
MONTH_NAME SALES_VAL SALES_QTY
JAN 4000 32
FEB 4020 33
MAR 4090 36
APR 4070 34
This will produce a chart With two LineS And four
Data points. the horizotal axis will Show the four Month names
As labels.
Minimum properties
Once you have dropped the SimpleChart Control onto a VFP Form,
you must Set certain properties. you can Do This either In the
Form Designer Or In Code (For example, In the Control's Init
Event).
the following are the Key properties that you must Set:
cAlias the Alias Of the Cursor (Or Table) containing the
Data To be plotted.
cData a Comma-Delimited List Of the Fields within the
cusor which Contain the actual Data.
In addition, you will probably want To Set one Or both Of the
following properties:
cRowLabels the Name Of the Field within the Cursor
containing the Row labels (These will appear
along the x-axis).
cLabels a Comma-Delimited List Of the labels that are To
appear In the legend (If Any).
To Continue With the above example, the following Code sets the
required properties:
With This
.cAlias = "csrSales"
.cData = "sales_val,sales_qty"
.cRowLabels = "month_name"
.cLabels = "Value,Quantity"
Endwith
Other properties
the above properties are the Only ones needed To Create a
Default chart. However, the Class also exposes many Other
properties that can be Used To customise the chart In various
ways. Some Of the more important Of These are listed below.
the folowing are Native properties Of the MSChart Control
(further Details can be Found In the Help File For the Control).
BorderStyle the Border For the entire chart (0 = no
Border, 1 = Single Line; Default 0).
ChartType 0=3D Bar, 1=2D Bar, 2=3D Line, 3=2D Line,
4=3D area, 5=2D area, 6=3D Step, 7=2D Step,
And several others (Default 3).
ShowLegend .T. To Show a legend (Default .F.).
And These are Custom properties that you might wish To Use:
cColours a Comma-Delimited List Of the colours To be Use
For the chart. the following colours are supported:
red, green, blue, black, white, grey, gray, yellow,
brown, magenta, cyan, darkblue, darkgreen
For example, If the chart has three series, the following
Code will Set These To blue, white And yellow
respectively:
This.cColours = "BLUE,WHITE,YELLOW"
(These are Not Case-sensitive)
cFootnote Text Of a small Title which appears At the Bottom
Of the chart
cTitle Text Of a Main Title For the chart; This appears
centred At the Top Of the chart
lIgnoreZero If .T., Any zero Values In the Data will Not
be plotted. (Default .F.).
lShowMarkers If T., Data points will be highlighted By Special symbols.
(Default .F.)
Creating the chart
Once you have Set the required properties, Call the Control's
CreateChart Method. This will Read the Cursor, populate the
chart With Data, And Display the chart. the Cursor must be Open
When you Call This Method.
Things that can Go wrong
If the CreateChart Method Is unable To Create the chart, it
will Return .F. And the chart will Not appear. If This happens,
you should Check the following:
- the Cursor Or Table containing the Data must be Open, And
its Alias stored In the cAlias property.
- the cData property must Contain the Name Of At least one Of
the (numeric) Fields From the Cursor.
ENDTEXT
Local m.lcdest
m.lcdest=Addbs(Sys(2023))+"ytemp.txt"
Strtofile(m.myvar,m.lcdest)
Run/N notepad &lcdest &&can use modi file (lcdest) noedit nomenu
Endproc
Enddefine
*2* draw a pie chart of MSChart activeX
*added on Thursday 10 march 2016

Publi yform
yform=Newobject("ychart")
yform.Show
Read Events
Retu
*
Define Class ychart As Form
    Height = 650
	Width = 900
	ShowWindow = 2
	AutoCenter = .T.
	Caption = "MSChart"
	Name = "Form1"

	Add Object simplechart1 As simplechart With ;
		Top = 0, ;
		Left = 0, ;
		Height = 528, ;
		Width = 876, ;
		Anchor = 15, ;
		Name = "Simplechart1"

	Add Object combo1 As ComboBox With ;
		FontSize = 10, ;
		Anchor = 768, ;
		Height = 25, ;
		Left = 204, ;
		Top = 549, ;
		Width = 136, ;
		Name = "Combo1"

	Add Object command1 As CommandButton With ;
		Top = 549, ;
		Left = 360, ;
		Height = 25, ;
		Width = 97, ;
		FontBold = .T., ;
		FontSize = 10, ;
		Anchor = 768, ;
		Caption = "Capture chart", ;
		BackColor = Rgb(128,255,0), ;
		Name = "Command1"

	Procedure Init
	Thisform.AddObject("yhelp1","yhelp")
	Thisform.yhelp1.Visible=.T.

	With Thisform.simplechart1
		.cAlias="ycurs"
		.cData="c1,c2,c3,c4,c5,c6,c7,c8,c9,c10,c11,c12"
		.cTitle="My 2d Pie chart title here"
		.ShowLegend=.T.
		.cLabels="JAN,FEB,MAR,AVR,MAI,JUN,JUL,AUG,SEP,OCT,NOV,DEC"
		.cFootnote="2015 results (here the footer)"
*additional properties to set for 2dPie chart
		.Anchor=15
		.chartType=14  &&2Dpie
		.Column=1
		.ColumnCount=12
		.columnLabelcount=12
		.columnLabelIndex=1
		.rowCount=1
		.RowLabelcount=12
		.Seriescolumn=1
		.Seriestype=24   &&2dPie
		.ShowLegend=.T.

		.createChart()

	Endwith
	Thisform.combo1.InteractiveChange()
	Endproc

	Procedure Load  &&create your cursor embedding data here (or select... from a physical table)
	Create Cursor ycurs (c1 N(10,2),c2 N(10,2),c3 N(10,2),c4 N(10,2),c5 N(10,2),c6 N(10,2),c7 N(10,2),c8 N(10,2),c9 N(10,2),c10 N(10,2),c11 N(10,2),c12 N(10,2))
	Insert Into ycurs Values(50000*Rand(),50000*Rand(),50000*Rand(),50000*Rand(),50000*Rand(),50000*Rand(),50000*Rand(),50000*Rand(),50000*Rand(),50000*Rand(),50000*Rand(),50000*Rand())
	Sele ycurs
*brow
	Endproc


	Procedure combo1.InteractiveChange
	#Define VtChLabelComponentValue 1 && The value of the data point appears in the label.
	#Define VtChLabelComponentPercent 2 && The value of the data point is displayed in the label as a percentage of the total value of the series.
	#Define VtChLabelLocationTypeInside 5 && Label Location - Inside pie or doughnut
	#Define VtChLabelLocationTypeOutside  6 && Label Location - Outside pie or doughnut
*write data on chart
	Do Case
	Case This.Value=1
		For Each obj In Thisform.simplechart1.Plot.SeriesCollection
			With obj.Datapoints.Item(-1).DatapointLabel
				.Component = VtChLabelComponentValue   &&show values
				.LocationType = VtChLabelLocationTypeInside && Inside pie slice
			Endwith
		Endfor

	Case This.Value=2
		For Each obj In Thisform.simplechart1.Plot.SeriesCollection
			With obj.Datapoints.Item(-1).DatapointLabel
				.Component = VtChLabelComponentPercent  && Show as percent
				.LocationType = VtChLabelLocationTypeInside && Inside pie slice
				.PercentFormat = '0%'
			Endwith
		Endfor
	Endcase
	Wait Window "Adjust dimensions chart by resizing form" Timeout 1
	Endproc

	Procedure combo1.Init
	With This
		.AddItem("Values on 2dPie")
		.AddItem("% on 2dPie")
		.ListIndex=1
		.Value=1
		.Style=2
	Endwith
	Endproc

	Procedure command1.Click  &&capture chart as image in MSPAINt (can save as png,jpg,bmp,gif.....)
	Thisform.simplechart1.editCopy()
	oshell=Createobject("wscript.shell")
	Thisform.WindowState=1
	Run/N "mspaint"
	Inkey(2)
	oshell.sendKeys('^{v}')
	Inkey(2)
	Thisform.WindowState=0
	Endproc

	Procedure Destroy
	Dele File Addbs(Sys(2023))+"ytemp.txt"  &&clean
	Clea Events
	Endproc

Enddefine
*
*-- EndDefine: ychart


*this is the class charts.vcx as prg below
*if you uncomment the 2 lines at the top (set classlib to ..), this is not needed.charts.vcx then must be in source folder
*if want to have 1 prg, then use this code below as class)
*SimpleChart class. Written by Mike Lewis (Mike Lewis Consultants class Ltd.), February - March 2002.  as vcx/vct
*converted as flat text class

Define Class simplechart As OleControl
	OleClass="MSChart20Lib.MSChart.2"
	Height = 246
	Width = 274
	Visible = .F.
*-- Alias of cursor or open table which contains the data for the chart
	cAlias = ""
*-- Comma-separated list of the fields within the cursor which contain the data for the columns of the chart
	cData = ""
*-- Comma-separated list of column labels; used for legend (if any)
	cLabels = ""
*-- Name of field within the cursor which holds the row labels.
	crowlabels = ""
*-- Comma-separated list of names of colours to use for bars or lines (e.g. Red, Blue, White)
	ccolours = ""
*-- Chart's main title
	cTitle = ""
*-- Text of chart's footnote
	cFootnote = ""
	Name = "simplechart"

*-- Says whether to ignore any zero data points
	lignorezero = .F.

*-- Says whether to show markers in the chart
	lshowmarkers = .F.

*-- Call this to create or update the chart, using data from the cursor
	Procedure createChart
* This does all the work needed to create or update the chart.
* It uses data from a cursor or an open table whose alias is stored
* in the cAlias property.

* To create a chart, follow these steps:
*   - Fill a cursor or table with the data to be graphed.
*   - Set cAlias to the alias of this cursor or table
*   - In cData, place a comma-delimited list of the fields from the
*        cursor whose values you want to plot (these must be numeric)
*   - In cRowLabels, store the name of the field from the cursor
*        which contains the row labels (if any).
*   -  In cLabels, store a comma-delimited list of the labels to be used
*      for the legend; these must correspond one-to-one with the field names
*      in cData.
*   - Set other properties as necessary.
*   - Call this method.
* For further information, see the Documentation method.

* The method performs simple error-checking, and returns .F. if the cAlias
* or cData properties are invalid

	Local lnFieldCount, lnCol, lnRow, lnLabCount, lnItem, lnI
	Local lcColStr, lcColVal, lcRed, lcGreen, lcBlue
	Local lnColIndex, lnColsToSet, lnRed, lnBlue, lnGreen

	With This

* Keep the chart invisible while it is being constructed
		.Visible = .F.

* Preliminary error-checking. If any of these checks fails,
* just exit without doing anything

* Check presence of cursor
		If Empty(.cAlias) Or Not Used(.cAlias)
			Return .F.
		Endif

		Select (.cAlias)

* Check that the list of data fields is present
		If Empty(.cData)
			Return .F.
		Endif

		lnFieldCount = Alines(laData,Strtran(.cData,",",Chr(13)))
&& the above line will fill an array with names of the fields
&& to be plotted; lnFieldCount will hold the number of fields

		If lnFieldCount = 0
			Return .F.
		Endif

		.ColumnCount = lnFieldCount
		.rowCount = 0

* scan the cursor, filling the data points as we go
		Count For Not Deleted() To .rowCount
		lnRow = 1
		Scan For Not Deleted()

			.Row = lnRow

* Fill data points for this record
			For lnCol = 1 To lnFieldCount
				.Column = lnCol
				lnItem = Evaluate(laData(lnCol))
				If lnItem>0 Or Not .lignorezero
					.Data = lnItem
				Endif
			Endfor

* Fill the row label for this record
			If Not Empty(.crowlabels)
				.rowLabel = Evaluate(.crowlabels)
			Endif

			lnRow = lnRow+1

		Endscan

* Set the legend captions
		If Not Empty(.cLabels)
* Unpack the labels
			lnLabCount = Alines(laLabs,Strtran(.cLabels,",",Chr(13)))
&& This will fill the laLabs array with the labels

			For lnCol = 1 To lnFieldCount
				If lnCol <= lnLabCount
					.Column = lnCol
					.columnLabel = laLabs(lnCol)
				Endif
			Endfor
		Endif

* Show markers (if required)
		For lnI = 1 To .ColumnCount
			.Plot.SeriesCollection(lnI).SeriesMarker.Show = .lshowmarkers
		Endfor

* Deal with colours
		If Not Empty(.ccolours)

* Create arrays containing the colour names and corresponding values
			lcColStr = "red,  green, blue,    black, white,   grey,   gray,   yellow, brown, magenta, cyan,     darkblue, darkgreen"
			lcColVal =  "255, 65280, 16711680,0,     16777215,8421504,8421504,65535,  128,   16711935,16776960, 8388608,  32768"
&& the above are 24-bit integer values, and are included for reference only
			lcRed =     "255, 0,     0,       0,      255,   128,     128,    255,    128,    255,    0,        0,        0"
			lcGreen =   "0,   255,   0,       0,      255,   128,     128,    255,    128,    0,      255,      0,        128"
			lcBlue   =  "0,   0,     255,     0,      255,   128,     128,    0,      0,      255,    255,      128,      0"
			Alines(lacolStr,Strtran(lcColStr,",",Chr(13)),.T.)
			Alines(lacolVal,Strtran(lcColVal,",",Chr(13)),.T.)
			Alines(laRed,Strtran(lcRed,",",Chr(13)),.T.)
			Alines(laGreen,Strtran(lcGreen,",",Chr(13)),.T.)
			Alines(laBlue,Strtran(lcBlue,",",Chr(13)),.T.)
&& ALINES() only valid in VFP 6.0 and above

* Put the list of required colours into an array
			.ccolours = Lower(.ccolours)
			lnColsToSet = Alines(laReqCols,Strtran(.ccolours,",",Chr(13)),.T.)

			lnColsToSet = Min(lnColsToSet,.ColumnCount)
&& We need to process the number of colours passed, or the number of
&& columns in the chart, whichever is lower

* Loop through the columns, setting the colours as required
			For lnI = 1 To lnColsToSet

* Locate this column's required colour in the colour name array
				lnColIndex = Ascan(lacolStr,laReqCols(lnI))

				If lnColIndex > 0

* Determine the red, green and blue elements
					lnRed = Val(laRed(lnColIndex))
					lnGreen = Val(laGreen(lnColIndex))
					lnBlue = Val(laBlue(lnColIndex))

* Set the bar's colours
					.Plot.SeriesCollection(lnI).Datapoints(-1).Brush.FillColor.Set(lnRed,lnGreen,lnBlue)

* Set colours for line series
					.Plot.SeriesCollection(lnI).Pen.vtColor.Set(lnRed,lnGreen,lnBlue)

				Endif
			Endfor
		Endif

* Deal with title and footnote
		If Not Empty(.cTitle)
			.Title.Text = .cTitle
			.Title.VtFont.Name = "Arial"
			.Title.VtFont.Size = 12
			.Title.VtFont.Style = 1  && bold
		Endif

		If Not Empty(.cFootnote)
			.Footnote.Text = .cFootnote
		Endif

* Make the chart visible
		.Visible = .T.

	Endwith

	Return .T.
	Endproc


*-- Read this to learn how to use this class.
	Procedure documentation
* Documentation for the class. Not intended to be executed.
	Return


	Endproc


Enddefine
*
*-- EndDefine: simplechart

Define Class yhelp As Label
	AutoSize = .T.
	FontSize = 18
	Anchor = 768
	BackStyle = 0
	Caption = "?"
	Height = 30
	Left = 468
	MousePointer = 15
	Top = 544
	Width = 15
	ForeColor = Rgb(0,255,0)
	Name = "Label1"


	Procedure Click
	TEXT to m.myvar textmerge noshow
	Method:simpleChart1.Documentation
	*******************************************************************
	*SimpleChart class. Written by Mike Lewis (Mike Lewis Consultants *
	*Ltd.), February - March 2002.                                    *
	*******************************************************************

	Copyright Mike Lewis Consultants Ltd. All rights Reserved.
	Feel Free To Use This Class In Any way you Like, but please
	Do Not Remove our Copyright notice Or the following disclaimer:

	Although we have tested This Class thoroughly, we cannot Accept
	Any legal liability For its Use. Do Not Use This Class unless you
	are satisfied that it works correctly In your Application.

	we welcome your feedback. please email Mike Lewis At mikl@compuserve.com
	Or see www.ml-consult.co.uk


	What does it Do?

	the SimpleChart Class produces two- And three-dimensional charts
	And graphs, using Data From a Visual FoxPro Table Or Cursor.


	What Do I need?

	the Class Is based On Microsoft's MSChart ActiveX control
	(MSChrt20.Ocx), which comes With VFP 6.0 And 7.0. To Use the
	Class, you will need the ActiveX Control To be installed On your
	own computer. To distribute applications which Use the Class,
	you will need To ensure that the Ocx File Is present And
	properly registered On the End-User's computer.


	How Do I Use it?

	the First Step Is To provide a Table Or Cursor which contains
	the Data required For your chart. Then Drop the Class On a VFP
	Form, Set certain properties, And Finally Call its CreateChart
	Method.


	the Cursor

	the chart Is Always populated With Data From a Cursor (Or
	Table). you can Use an existing Cursor If it already contains
	the required Data, Or you can Create one specifically For This
	purpose.

	the Cursor must have the following characteristics:

	- a Record For Each Data Point On the chart.

	- a Field For Each Of the series On the chart. These Fields must
	be numeric.

	- Optionally, a Field containing the Row Label For the Current
	Record. This Field must be a Character String.

	As an example, suppose you wanted To plot monthly sales Value
	And monthly sales quantity For the Year To Date. your Cursor might Look
	something Like This:

	MONTH_NAME      SALES_VAL      SALES_QTY
	JAN             4000             32
	FEB             4020             33
	MAR             4090             36
	APR             4070             34

	This will produce a chart With two LineS And four
	Data points. the horizotal axis will Show the four Month names
	As labels.


	Minimum properties

	Once you have dropped the SimpleChart Control onto a VFP Form,
	you must Set certain properties. you can Do This either In the
	Form Designer Or In Code (For example, In the Control's Init
	Event).

	the following are the Key properties that you must Set:

	cAlias    the Alias Of the Cursor (Or Table) containing the
	Data To be plotted.

	cData     a Comma-Delimited List Of the Fields within the
	cusor which Contain the actual Data.

	In addition, you will probably want To Set one Or both Of the
	following properties:

	cRowLabels     the Name Of the Field within the Cursor
	containing the Row labels (These will appear
	along the x-axis).

	cLabels   a Comma-Delimited List Of the labels that are To
	appear In the legend (If Any).

	To Continue With the above example, the following Code sets the
	required properties:

	With This
		.cAlias = "csrSales"
		.cData = "sales_val,sales_qty"
		.cRowLabels = "month_name"
		.cLabels = "Value,Quantity"
	Endwith


	Other properties

		the above properties are the Only ones needed To Create a
		Default chart. However, the Class also exposes many Other
		properties that can be Used To customise the chart In various
		ways. Some Of the more important Of These are listed below.

		the folowing are Native properties Of the MSChart Control
		(further Details can be Found In the Help File For the Control).


		BorderStyle    the Border For the entire chart (0 = no
		Border, 1 = Single Line; Default 0).

		ChartType      0=3D Bar, 1=2D Bar, 2=3D Line, 3=2D Line,
		4=3D area, 5=2D area, 6=3D Step, 7=2D Step,
		And several others (Default 3).

		ShowLegend     .T. To Show a legend (Default .F.).

		And These are Custom properties that you might wish To Use:

		cColours		a Comma-Delimited List Of the colours To be Use
		For the chart. the following colours are supported:
		red, green, blue, black, white, grey, gray, yellow,
		brown, magenta, cyan, darkblue, darkgreen
		For example, If the chart has three series, the following
		Code will Set These To blue, white And yellow
		respectively:
		This.cColours = "BLUE,WHITE,YELLOW"
		(These are Not Case-sensitive)

		cFootnote		Text Of a small Title which appears At the Bottom
		Of the chart

		cTitle			Text Of a Main Title For the chart; This appears
		centred At the Top Of the chart
		lIgnoreZero  	If .T., Any zero Values In the Data will Not
		be plotted. (Default .F.).

		lShowMarkers	If T., Data points will be highlighted By Special symbols.
		(Default .F.)

		Creating the chart

		Once you have Set the required properties, Call the Control's
		CreateChart Method. This will Read the Cursor, populate the
		chart With Data, And Display the chart. the Cursor must be Open
		When you Call This Method.

		Things that can Go wrong
		 		If the CreateChart Method Is unable To Create the chart, it
					will Return .F. And the chart will Not appear. If This happens,
					you should Check the following:

					-    the Cursor Or Table containing the Data must be Open, And
					its Alias stored In the cAlias property.

					-    the cData property must Contain the Name Of At least one Of
					the (numeric) Fields From the Cursor.

	ENDTEXT

	Local m.lcdest
	m.lcdest=Addbs(Sys(2023))+"ytemp.txt"
	Strtofile(m.myvar,m.lcdest)
	Run/N notepad &lcdest     &&can use modi file (lcdest) noedit nomenu
	Endproc

Enddefine